The Texas Water Damage Ledger — 2026 edition
2026 edition · version 2026-Q3.1 · flood-claim record through 2026
Every flood-insurance claim the National Flood Insurance Program has paid on a Texas building, from 1978 to 2026, compiled by county. Countyguard publishes this because the federal government releases the record but nobody assembles it into a form a Texan can read.
As of May 2026, FEMA’s NFIP record contains 301,687 Texas claims with $13.39 billion in recorded building payments.
What the record shows
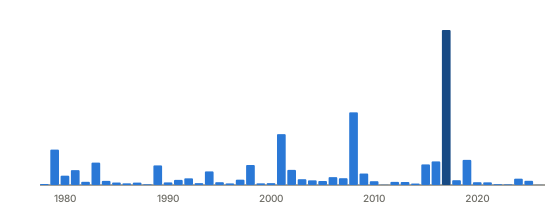
Texas flood loss is episodic, not annual. Of the 22 counties with at least 1,000 paid claims on record, 11 have a single loss year holding 30% or more of everything ever paid there — and for 8 of those 11, that year is 2017. A county can go a decade with almost no claims and still hold most of its flood history in one twelve-month period, which is why a quiet recent record is weak evidence about the next year.
Statewide claims by loss year
Claims with a recorded NFIP building payment, grouped by year of loss. Recent rows are marked under the same provisional-year rule used on county pages.
| Loss year | Claims with recorded building payments |
|---|---|
| 1978 | 475 |
| 1979 | 17,265 |
| 1980 | 4,541 |
| 1981 | 7,258 |
| 1982 | 1,569 |
| 1983 | 10,959 |
| 1984 | 2,010 |
| 1985 | 1,228 |
| 1986 | 818 |
| 1987 | 1,152 |
| 1988 | 348 |
| 1989 | 9,590 |
| 1990 | 1,293 |
| 1991 | 2,485 |
| 1992 | 3,262 |
| 1993 | 946 |
| 1994 | 6,649 |
| 1995 | 1,344 |
| 1996 | 759 |
| 1997 | 2,568 |
| 1998 | 9,747 |
| 1999 | 851 |
| 2000 | 936 |
| 2001 | 24,852 |
| 2002 | 7,357 |
| 2003 | 2,839 |
| 2004 | 2,299 |
| 2005 | 1,961 |
| 2006 | 3,865 |
| 2007 | 3,308 |
| 2008 | 35,487 |
| 2009 | 5,600 |
| 2010 | 1,841 |
| 2011 | 85 |
| 2012 | 1,502 |
| 2013 | 1,460 |
| 2014 | 754 |
| 2015 | 10,063 |
| 2016 | 11,515 |
| 2017 | 75,681 |
| 2018 | 2,354 |
| 2019 | 12,251 |
| 2020 | 1,366 |
| 2021 | 1,333 |
| 2022 | 375 |
| 2023 | 317 |
| 2024 | 3,081 |
| 2025 (provisional) | 2,049 |
| 2026 (year to date) | 39 |
Counties by total flood-claim payments
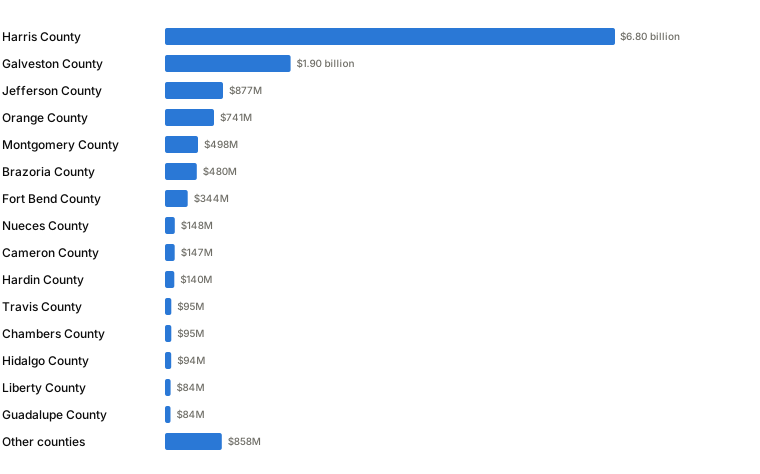
The 15 counties with the largest recorded building payments on the whole NFIP record. Nominal dollars — not adjusted for inflation.
| County group | Claims | Recorded building payments |
|---|---|---|
| Harris County | 135,381 | $6,803,223,010 |
| Galveston County | 46,946 | $1,898,791,912 |
| Jefferson County | 17,170 | $877,295,865 |
| Orange County | 10,854 | $740,773,872 |
| Montgomery County | 10,921 | $498,317,089 |
| Brazoria County | 16,669 | $480,475,999 |
| Fort Bend County | 4,993 | $343,815,878 |
| Nueces County | 5,050 | $147,651,596 |
| Cameron County | 4,857 | $146,898,961 |
| Hardin County | 2,029 | $140,282,309 |
| Travis County | 3,230 | $95,170,004 |
| Chambers County | 1,697 | $94,696,018 |
| Hidalgo County | 3,344 | $93,704,365 |
| Liberty County | 2,736 | $84,119,755 |
| Guadalupe County | 2,058 | $83,726,089 |
| Other counties | 33,752 | $858,350,434 |
Counties by claims per 1,000 homes
The same record measured against how many homes each county has, which is the comparison a total cannot make. Housing units are from the US Census American Community Survey.
| County | Claims per 1,000 homes | Paid claims | Homes |
|---|---|---|---|
| Galveston County | 290 | 46,946 | 161,868 |
| Orange County | 286 | 10,854 | 37,937 |
| Jefferson County | 156 | 17,170 | 109,884 |
| Aransas County | 125 | 1,997 | 15,999 |
| Brazoria County | 111 | 16,669 | 150,321 |
| Chambers County | 90 | 1,697 | 18,937 |
| Hardin County | 81 | 2,029 | 25,100 |
| Matagorda County | 76 | 1,445 | 19,058 |
| Liberty County | 76 | 2,736 | 36,121 |
| Newton County | 74 | 482 | 6,492 |
| Harris County | 71 | 135,381 | 1,917,790 |
| Wharton County | 55 | 968 | 17,711 |
| Haskell County | 45 | 138 | 3,081 |
| San Patricio County | 44 | 1,326 | 30,435 |
| Willacy County | 43 | 294 | 6,885 |
For journalists
As of May 2026, FEMA’s NFIP record contains 301,687 Texas claims with $13.39 billion in recorded building payments.
- Texas has 301,687 claims with recorded NFIP building payments, as of May 2026, according to FEMA’s NFIP Redacted Claims v2 dataset.
- Texas NFIP claims carry $13.39 billion in recorded building payments, as of May 2026, according to FEMA’s NFIP Redacted Claims v2 dataset.
- Loss year 2017 contributes 75,681 Texas claims with recorded building payments, as of May 2026, according to FEMA’s NFIP Redacted Claims v2 dataset.
- 11 Texas counties have one loss year holding at least 30.0% of their recorded building payments, as of May 2026, according to FEMA’s NFIP Redacted Claims v2 dataset.
Attribution: “Countyguard compiles public federal records so readers can inspect the same county-level evidence we use,” according to Eldhurst LLC.
Downloadable graphics: Statewide claims by loss year SVG (6,754 bytes) · Ranked county payments SVG (4,421 bytes)
Data and citation: Quotable statistics page · County summary CSV · Claims by year CSV · Data dictionary · Dataset DOI
Reuse these charts and data under CC BY 4.0 with attribution to Eldhurst LLC.
How this was built, and what it does not say
Figures are compiled from FEMA's National Flood Insurance Program redacted claims file: claims with a recorded building payment greater than zero, counted by year of loss, with no date window. Statewide totals cover all 254 Texas counties. The rankings cover the 107 counties with at least 50 paid claims on record, which together hold 300,411 of the 301,687 claims statewide. Dollar figures are nominal dollars — not adjusted for inflation, so a 1979 payment and a 2024 payment are added together as printed. This is a record of what the NFIP PAID, not a measure of flood risk, of damage that went unclaimed, or of losses covered by other policies — most water damage inside a home is not a flood-insurance matter at all.
Download the stable county CSV · Download claims by year · Read the data dictionary · Machine-readable schema
Countyguard, “The Texas Water Damage Ledger,” 2026 edition. Countyguard, a brand of Eldhurst LLC. Retrieved from https://www.countyguard.com/water-damage/tx/ledger/ DOI: https://doi.org/10.5281/zenodo.21673247.
Underlying data: FEMA National Flood Insurance Program redacted claims, and US Census American Community Survey housing units. Full method: whole-record methodology.
Published by Eldhurst LLC, which is accountable for what this site publishes. Countyguard is not a licensed adjuster, contractor, engineer, or attorney. Corrections and questions: support@countyguard.com.